Debugging tests
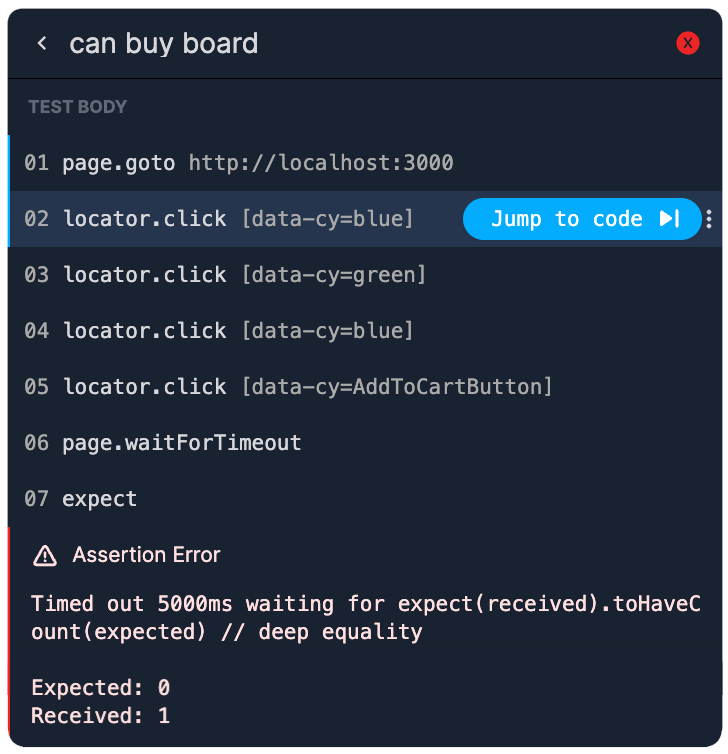
Jump to code
Replay integrates your Playwright tests with your application, providing a deeper understanding of what happens when a test executes actions locator.click(). When a test clicks, you can see which function in your application was called, instead of only seeing the result.
This helps you not only identify test failures but also understand the context and the progression of events leading to those failures. By working backwards from a failure, you can investigate it more thoroughly and address its root cause.
Follow the data trace
Every line of code that was executed can be further inspected by adding a console.log. For example, when a test click triggers a function call, you can view the inputs and outcomes of that function. This provides you with a deeper understanding of your application's behavior.
When you run your Playwright test, Replay allows you to see which specific lines of code in your application are executed, indicated by hit counts. This feature helps you understand the flow and coverage of your tests within the app. When debugging, you can see which lines of code were executed and which were not. This you helps reveal patterns in your flaky tests.
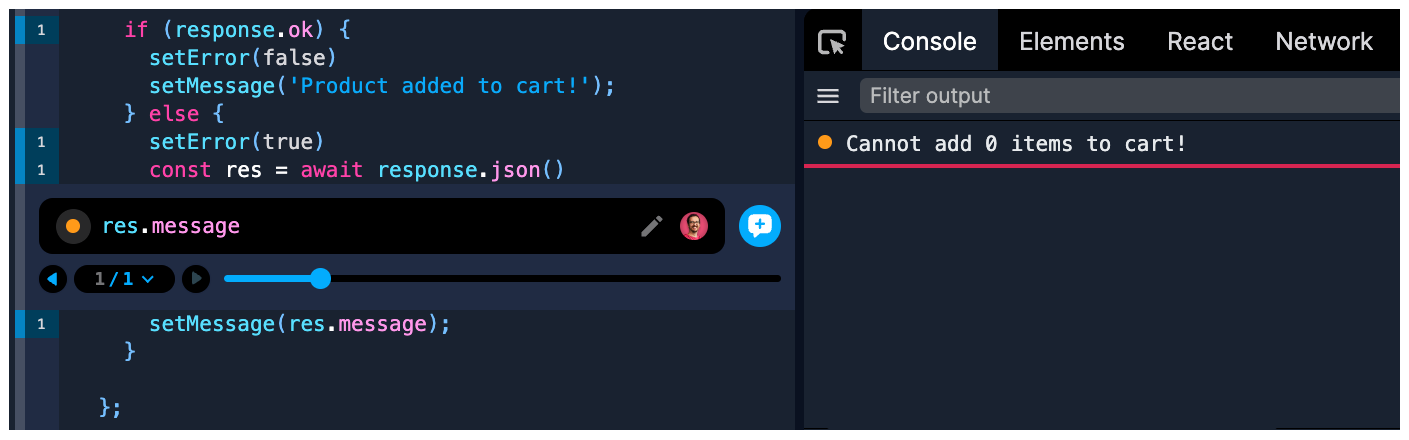
Console log with hit count on the left, output on the right
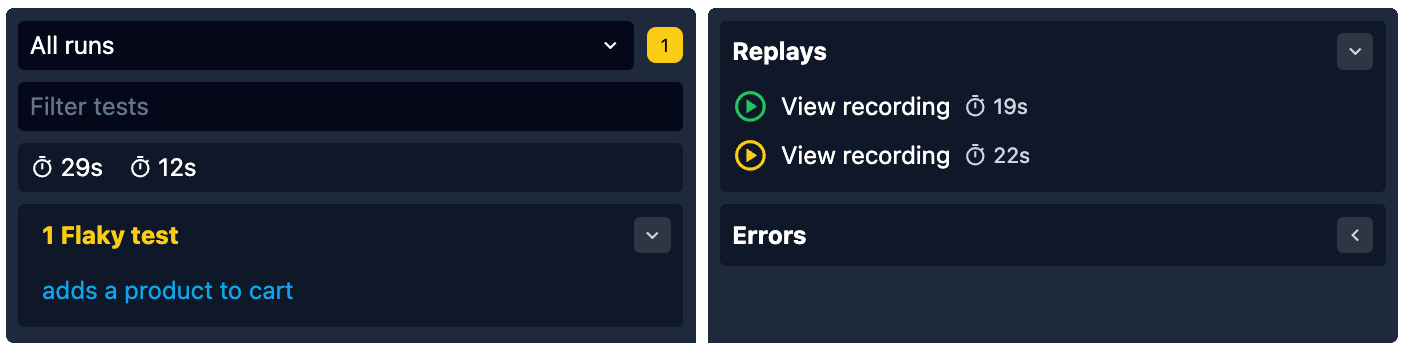
Compare failing and passing tests
A great way to narrow down the root casue of a flaky test is to open two replays - one with a passed test and one with the failed one. Usually the recording can give you enough information to notice the moment when these two tests start to diverge.
A test failure usually ends in "element not found" or other similar message, but this is usually not enough. End-to-end tests carry a lot more context which can be gathered by looking at what the test was doing before it failed.
See your test steps
The test body feature enables you to view each step of your test as it was executed.
You can see every locator, assertion, and interaction made by your test script, providing you with an overview of your test run.
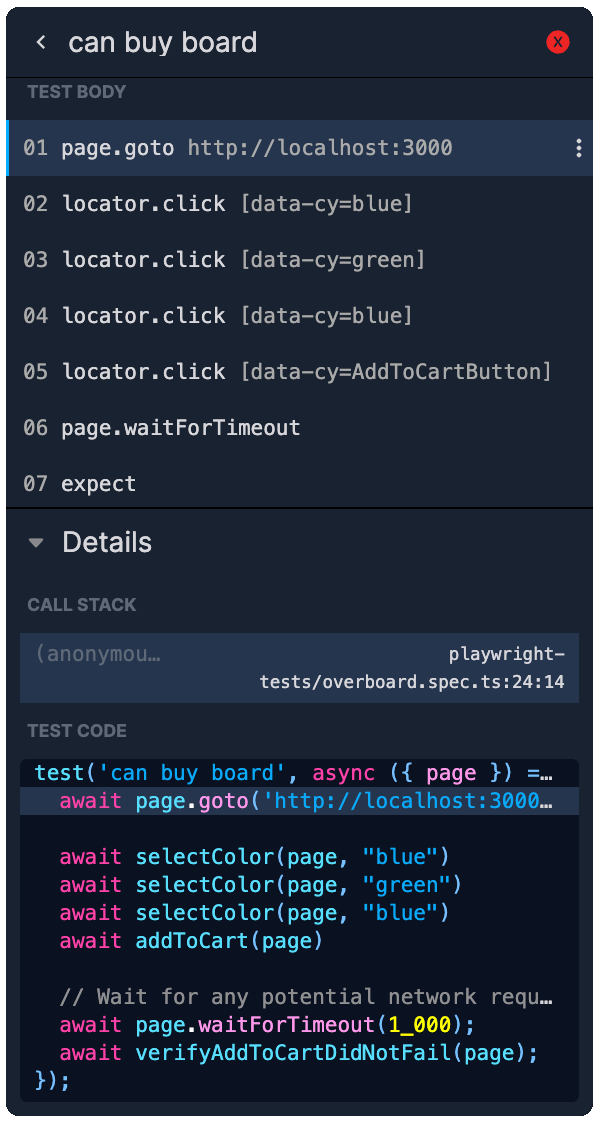
The test code frame feature lets you examine your test definition along with its entire call stack.
This enables you to jump into each function that was called, providing a detailed view of the execution flow during your test.
React panel
When you view Component props, state, and hooks in the React panel, you’ll see the values which triggered the last render. This is one of those useful features that you didn’t realize you were missing until you have. Learn more about React panel here.
Replay vs. Playwright trace viewer
Replay offers capabilities similar to Playwright’s trace-viewer but with more features and more power. In addition to exploring DOM snapshots, network information, and test steps, Replay allows you to view the source code of the application under test.
This enables a deeper understanding not only of the effects of your tests but also of the flow of your application's logic, providing comprehensive insights into how your application responds during testing. You can read more about these differences in the comparison article.