Inspect your replay
Once your replay is uploaded, you can inspect it with Replay DevTools.
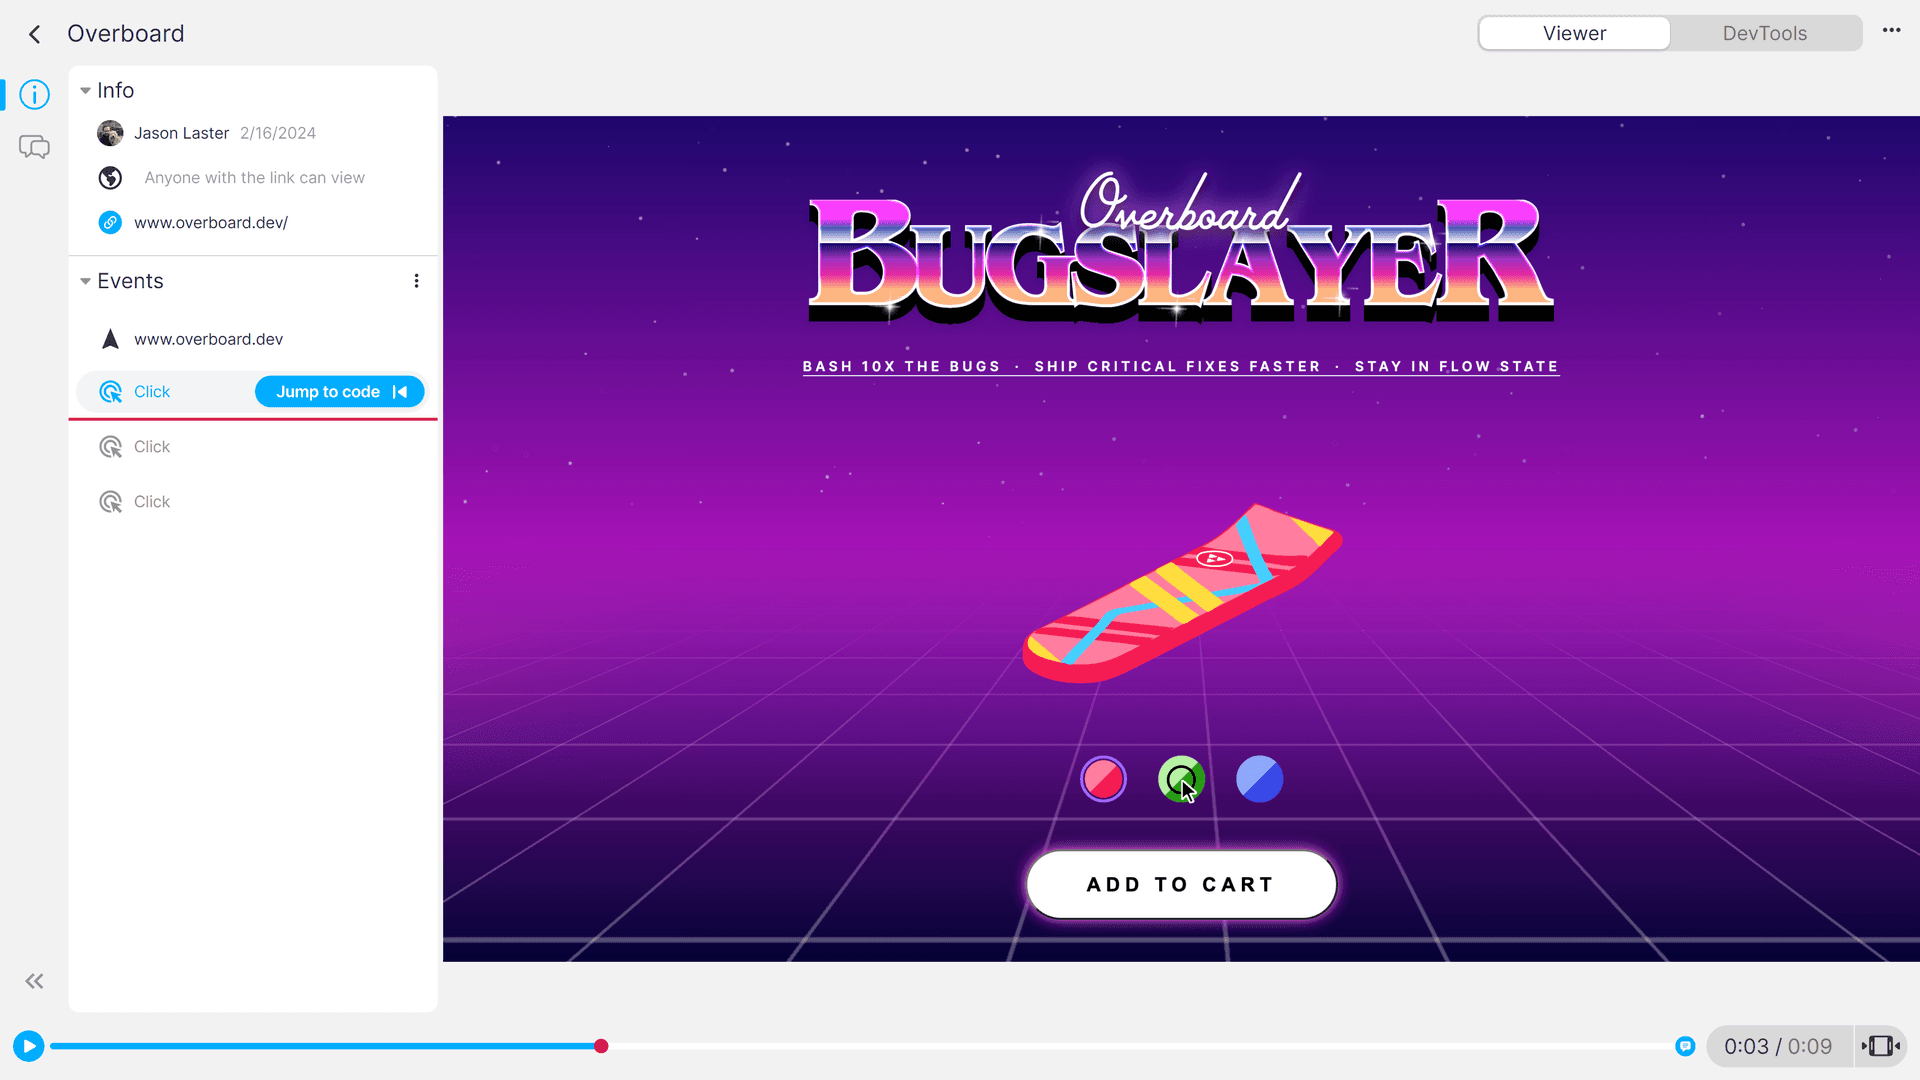
View the timeline
By default, you're set to "Viewer" mode. You can change the view to "DevTools" mode either by pressing the toggle in the top-right corner or by selecting an "Event" and pressing "Jump to code"
Jump to an event
Let's jump to the last "Click" before the replay hit an error and see the code related to it:
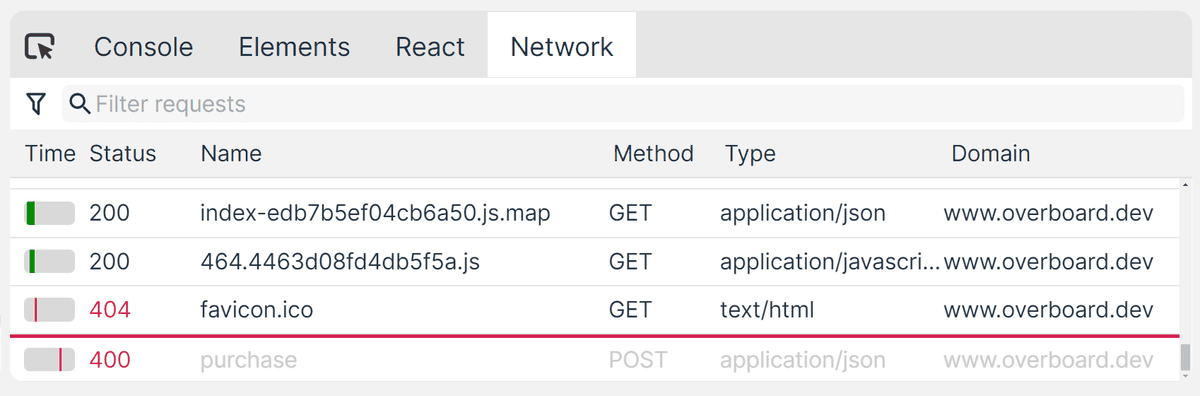
Inspect network calls
It looks like we're making a "POST" to an endpoint of "/api/purchase". Let's open our network panel and see what the request looks like:
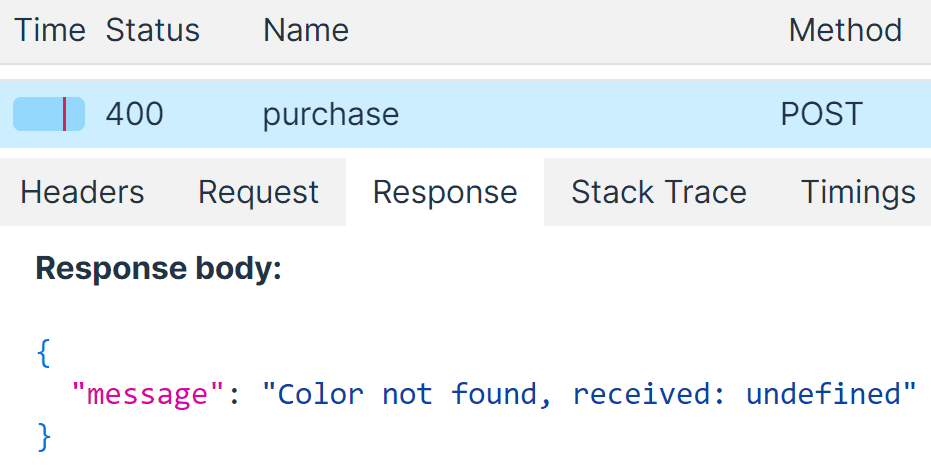
Selecting the 400 error in the network panel allows us to look at the request and response. Here, the response from our backend was "Color is not found, received: undefined":
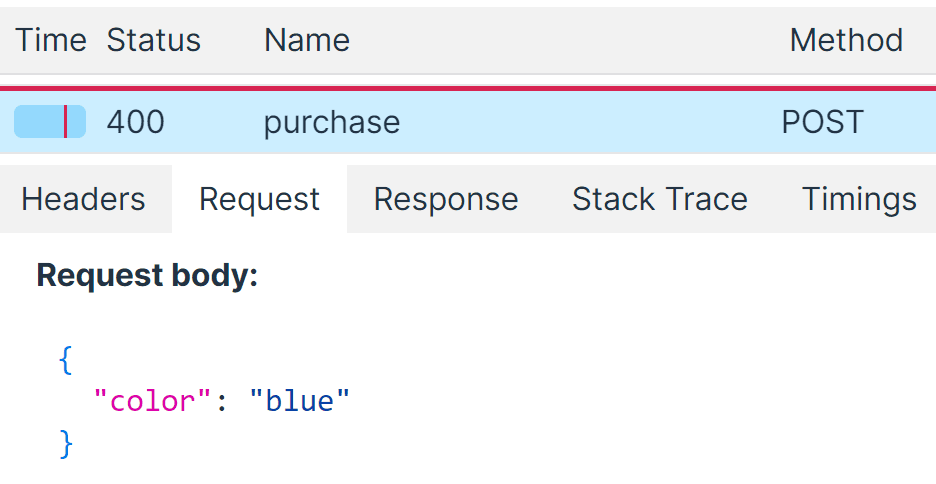
But looking at the request body, it looks like we're sending the color along just fine:
With this information, we can send our backend team a more detailed bug report.