Pause panel
Inspect local variables and parent frames with the Pause panel.
Basics
The Pause panel includes everything you’d expect to see in Chrome DevTools plus some additional functionality that’s only possible with time travel.
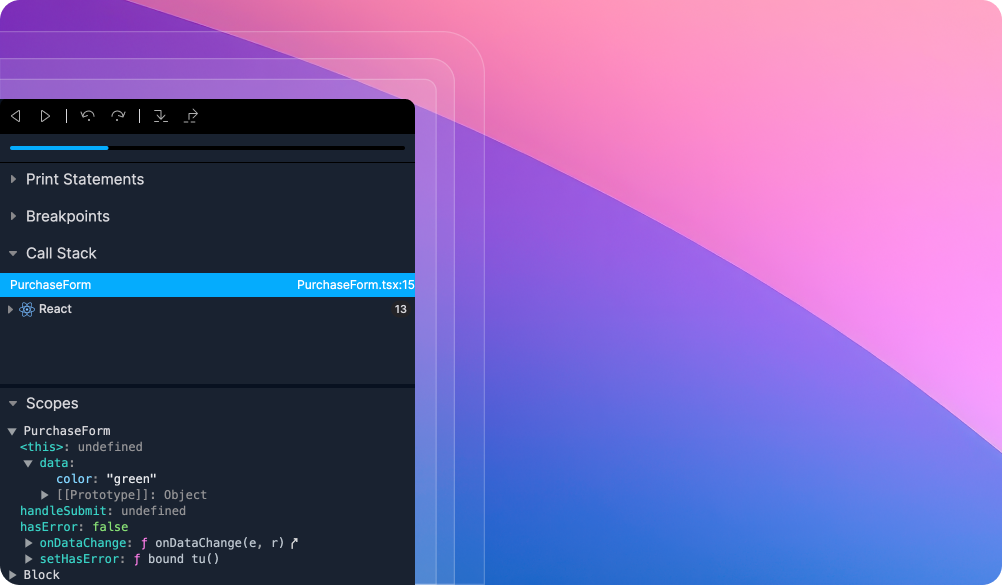
Call stacks
The call stacks pane lets you see the path that the program took through the code to get to the current pause.
And with the ability to select a frame, and step forward or backwards from there, it’s never been easier to work backwards and understand the sequence of events.
Scopes
The scopes pane lets you inspect the values in the local scope and surrounding scopes and build a mental model of the application state at the current pause point.
Stepping + resuming
Traditional debuggers let you pause at breakpoints, resume, step forward, in, and out. And when you’re stepping there’s always the risk that you stepped too far and have to refresh and redo your steps.
With Replay, it’s possible to pause at a point in time, step forwards or backwards and resume or rewind. And because you can go anywhere, you never have to worry about going too far.
Breakpoints
The breakpoints pane helps you manage the breakpoints you’ve set in the replay and see the breakpoints that others have set as well.
Print statements
The print statements pane helps you manage the console logs you’ve set in the replay and see the console logs that others have set as well.
Time Travel
Function timeline
One of the most unique features in Replay is the function timeline which lets you scrub through the current function’s execution and see the path that it took. This is especially useful for complex functions with many branches and loops.
Async call stacks
One of the most frustrating limitations in traditional browser DevTools is the fact that async call stacks with setTimeout, await , and fetch can show you the functions that lead to the async boundary, but you can’t select them and view the in scope values because the frame has been garbage collected.
With time travel, when you select a frame before an async boundary it’s now possible to play to these points and show you the in scope values.