Source viewer
Explore your code base with the source viewer
Basics
Replay DevTools includes all of the features you would expect to find in VS Code to navigate your codebase and find the relevant functions.
Full text search
Press cmd+shift+f or click the search button in the right toolbar to launch Full Text Search and find the code you’re looking for.
Full Text Search includes many of the functionality you expect like path include and exclude rules and regex search as well as some time travel enabled features like dimmed out results for code that was not executed.
Source search
Press cmd+f to search the source code for the file you’re currently viewing.
Source outline
Press cmd+shift+o or open the Source panel in the right toolbar, to view the functions defined in the current file and see the number of times each function was called.
Source explorer
Press cmd+p or open the Source explorer in the right toolbar, to view the sources that were loaded in the replay.
Note that because replays can span multiple navigations and include source maps, the sources you’re viewing will include original files and could be included in multiple pages.
Jump to generated location
Replay DevTools defaults to showing the original source code. This means that whe you’re viewing a file, there’s a good chance that it’s either been source mapped or that it’s been pretty printed.
We default to showing the original source code because we want viewing the source code in Replay to feel like you’re viewing the code in your IDE, but at any point you can right click and select “jump to generated location” or select “view generated source” in the footer.
Source Map explorer
Most of the time you should not have to think about the source mapping between your original code and the generated minified code that runs in the browser.
When you believe there’s a source mapping issue though, it can be helpful to click on the source map explorer button in the footer and view the mappings.
Time Travel
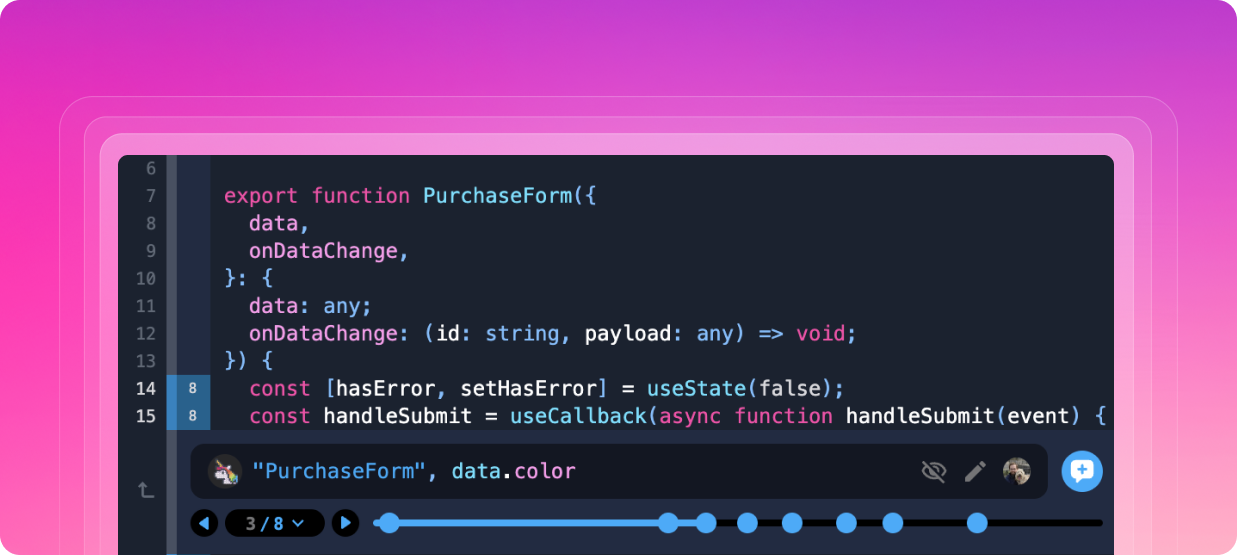
Hit counts
Source level hit counts let you see at a glance which lines of code were executed and let you know how many messages you’ll see in the Console when you add a log.
Adding console logs
Hover over the side gutter and click on the + button in the source viewer to add console logs. With live autocomplete and instant replay, there’s never been a faster debugging feedback loop.
Jumping to a line
Hold down ⌘ or ⌘ + ⇧ to jump to the next or previous time a line has been hit.
Alternatively, you can add a breakpoint in the gutter and select resume or rewind in the pause panel. While adding breakpoints will feel familiar and can be useful in some cases, they come with the downside that when you resume you don’t know which breakpoint you’ll hit.
Learn more
Learn how to navigate your source code effectively. This tutorial will teach you how to search within your code, view hit counts to see how often lines are executed, and jump directly to any line of execution. You can find the whole course at replay.help/course