Network monitor
Inspect requests with the Network monitor.
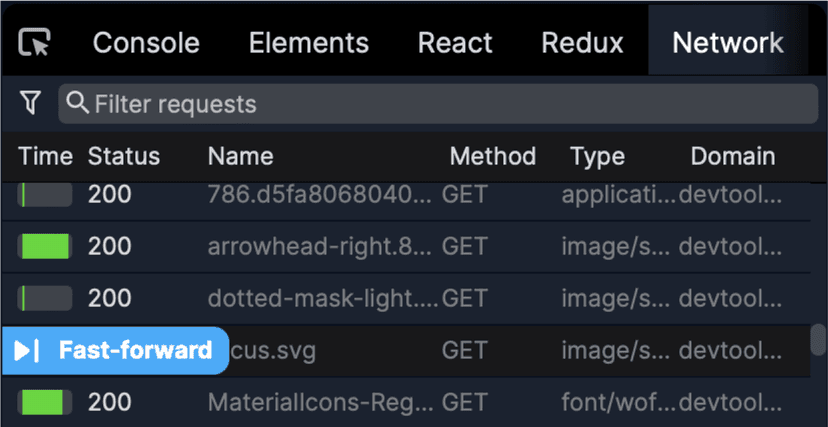
Viewing the resource list
Filter by request type
To filter by requests by type, click on the FilterButton on the top left and select the types you’d like to see. For example. Fetch, Image, WebSocket, Javascript.
Filter by path
To filter the requests shown in the list, focus on search input on the top of the panel and enter the path you’re looking for.
Jump to fetch
The Jump button helps you seek to the point in time where the fetch was initiated and inspect the local state.
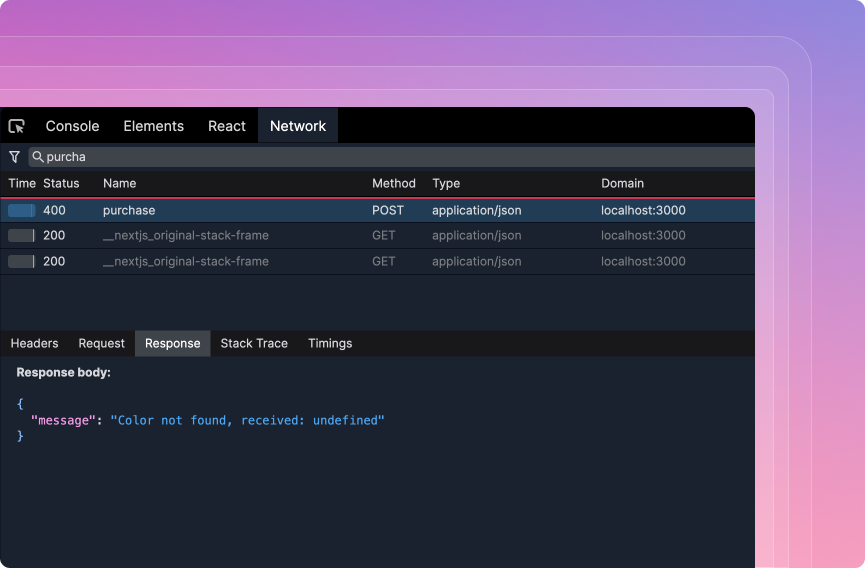
Inspecting resource details
- Headers Shows HTTP headers and general information about the resource such as status code.
- Request Shows the request body.
- Response Shows the response body.
- Stack trace Shows the stack trace associated with the request which is useful for jumping to the relevant source code.
- Timings Shows the timing information which is useful for understanding the waterfall.
Learn more
Watch this video to see the Network panel in action. Learn how to use the network panel to search and filter requests, examine details like status codes, payloads, and response headers, and discover how to quickly navigate to specific requests. You can find the whole course at replay.help/course
Coming soon
Search requests
The search panel will help you search for resources by request and response body.
GraphQL panel
The GraphQL panel will help you inspect GraphQL requests, mutations.