Console
See how your application state changes over time with interactive console logs.
Basics
Add live console logs
You can add new console logs in Replay DevTools by hovering over a line of code, clicking the + button, adding an expression, and pressing “save”. When you add a new log, the messages will appear in the Console as if they had always been there.
Evaluate expressions
When you’re paused, one of the best ways to get additional context is to evaluate expressions in the JS terminal at the bottom of the Console.
And because you’re able to evaluate anything you’d like and then resume, it's safe to try anything you’d like without fear of corrupting the local state.
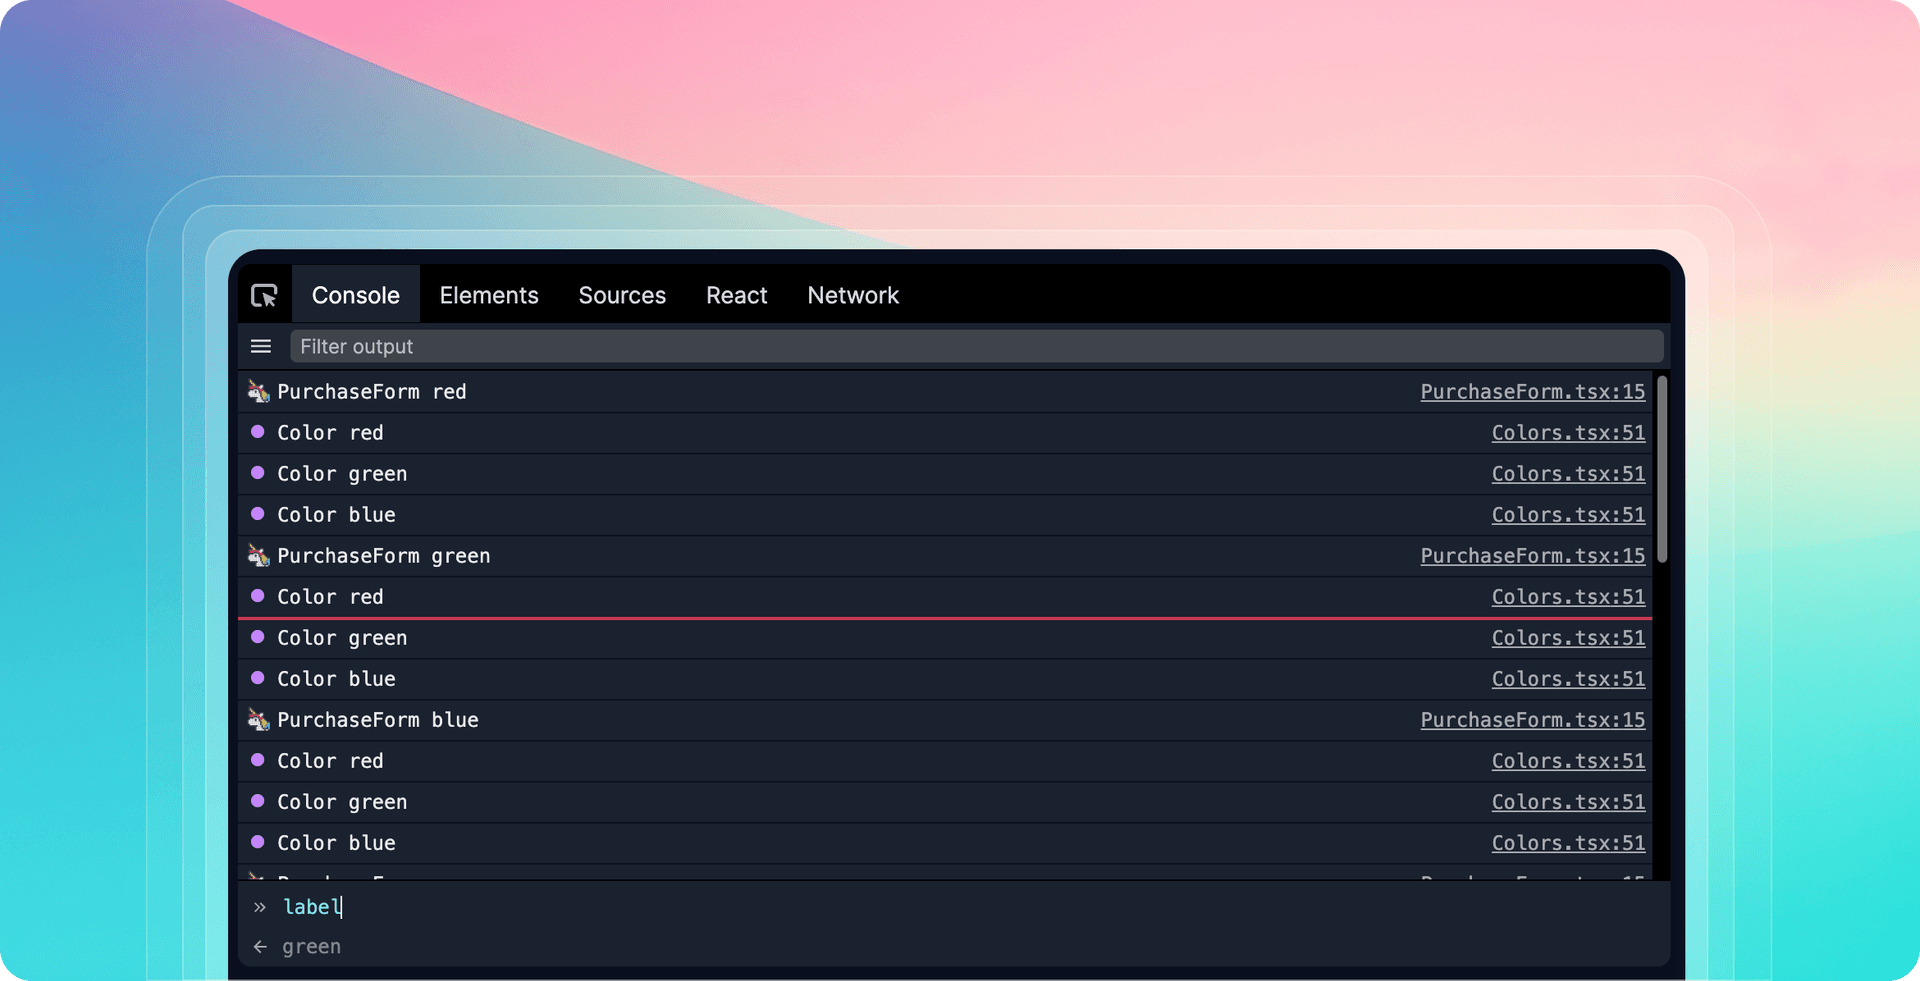
Add a console message prefixes
A nice way to spot patterns in the Console logs is to add a color label to the console messages so that you can quickly spot the pattern.
Filter console messages
It’s common for the Console to be filled with hundreds of messages. When that’s the case and you want to find a handful of messages, you can use the input filter at the top to filter the messages.
Search console messages
When you want to find a particular message, and you also want to see all of the other messages, you can press cmd+f to search for the next message that matches.
View messages from node modules
By default we hide messages that come from node_modules because most of the time you don’t need them, but if you’d lke to see them you can open the Console sidebar, scroll down, and select Node modules.
View console message timestamps
By default we don’t show the timestamps associated with each console message, but if you’re debugging a timing sensitive issue, you can open the Console sidebar, scroll down, and select Timestamps.
Time Travel
Jump to console messages
When you want to learn more about what was happening at the time that a Console message was logged, you can click the jump button and seek to that point in time.
When you jump, a browser in the cloud will pause at that execution point, repaint the graphics, and be available for you to evaluate expressions on the fly.
Expand object properties
As developers we take it for granted that we can expand object properties in the Console. What’s easy to miss though is that when you expand an object like this, you’ll view the properties values as they exist now and not see what they were at the time they were logged.
This is one of the most egregious cases where browser DevTools will lie to you and potentially cause you to go in the wrong direction. When you expand an object property with Replay, you’ll get the correct property values and you'll see the values as they were at that exact point in time.
Anchor the focus window to a message
A powerful way to bisect a difficult problem down to the root cause is to set the focus window start or end to a console message.
Setting the focus window will limit the execution range in the replay which will hide the messages and other events that are outside of the window and let you progressively zero in on the root cause.
View JS event handlers
One of the easiest ways to see which JS function handled a user click, random scroll event, or websocket message, is to open the Console sidebar, select the relevant event listener category, and log the handlers to the Console.
Learn more
Learn how to use console logs to print information from your source code. This tutorial will show you how to navigate the timeline by fast forwarding or going back, and how to filter your console logs for more efficient debugging. You can find the whole course at replay.help/course