Cypress timeline
Inspect your Cypress test as if it’s running locally with the Cypress timeline.
Basics
The Cypress timeline includes many of the features you’re accustomed to when debugging your test locally and some functionality that’s only possible with time travel.
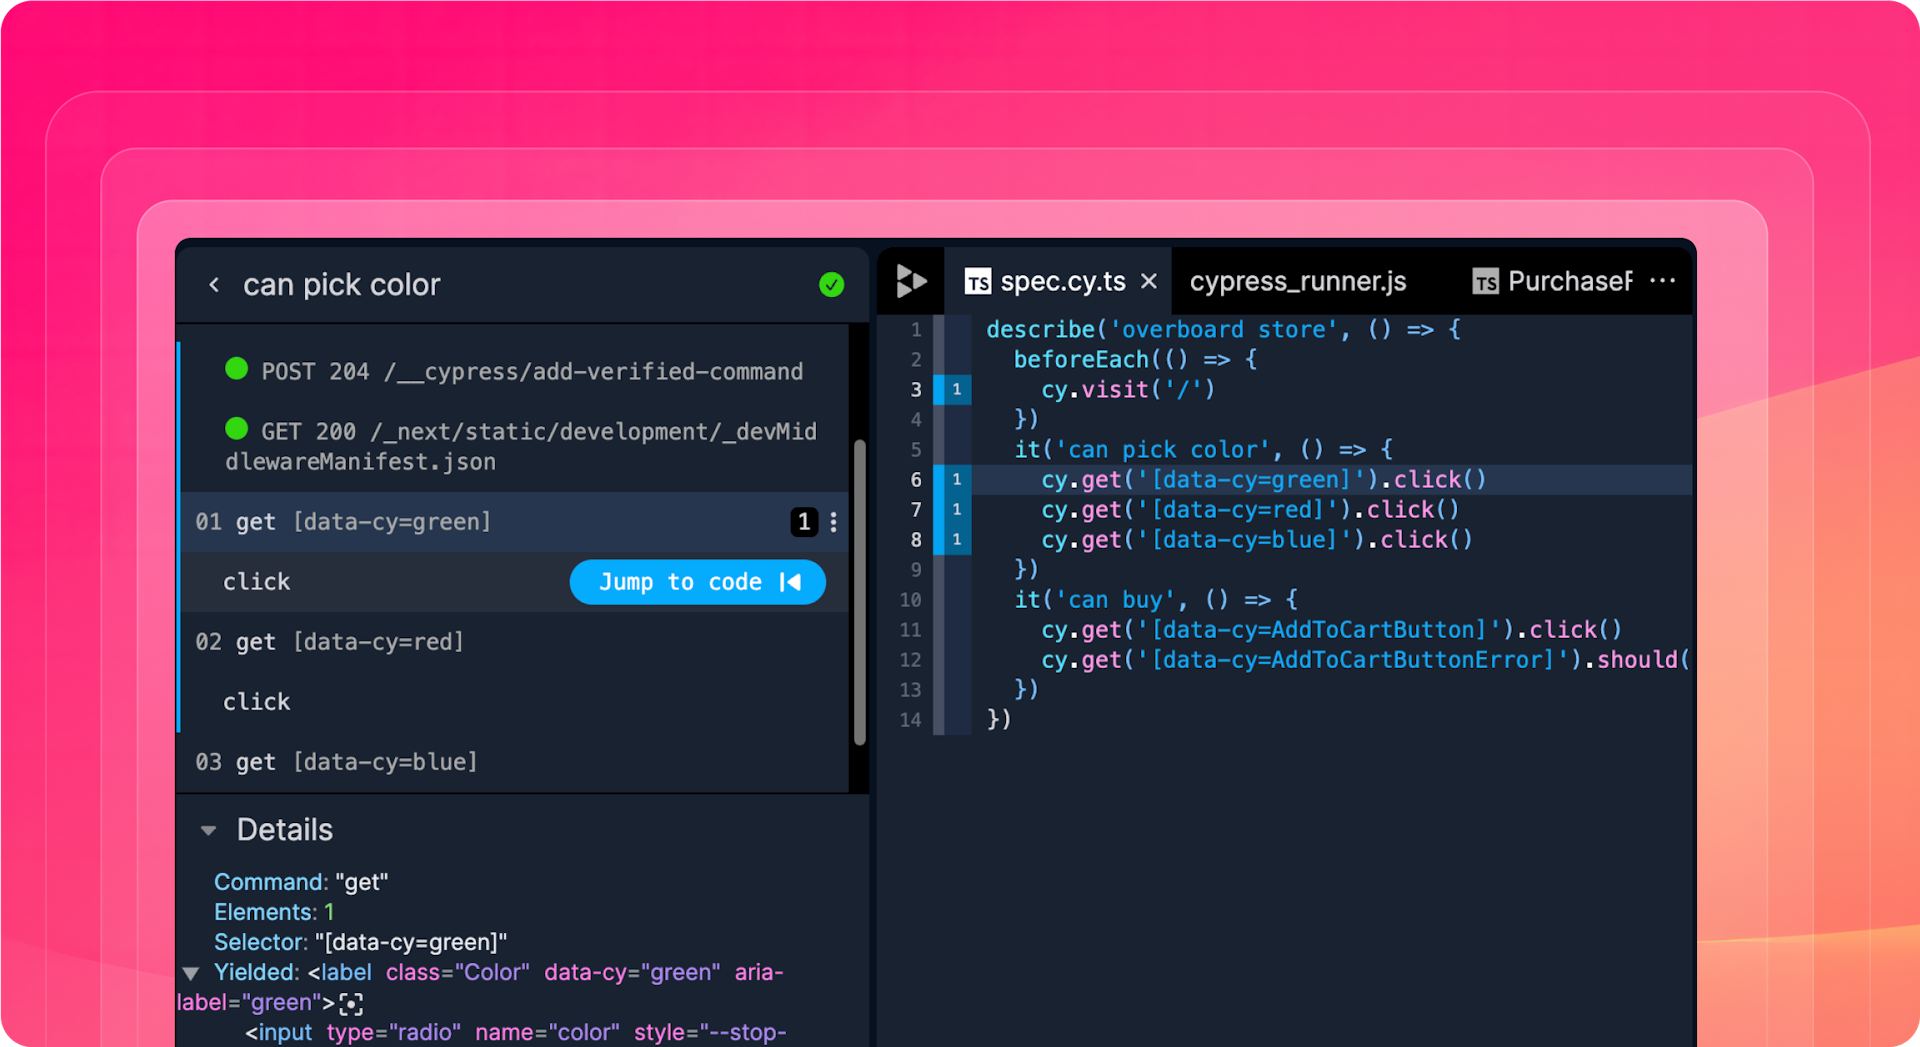
Step actions
When you select a a test step action, you jump to that point in time and the location in the source code where the Cy action was executed.
Step events
The timeline shows relevant network events and lets you jump to the request in the Network monitor.
Step details
Selecting a step shows the step details below with the ability to jump from the test subject to the element in the Elements panel.
Time Travel
Jump to code
Clicking the Jump to code button seeks you from the test step into your React component’s event handler. There’s never been a more powerful way to start debugging a flaky test.
Check out this replay for a detailed walkthrough on debugging a flaky Cypress test. You'll see the capabilities of Replay DevTools and walk through the debugging process of identifying the root cause.