Test Suite Dashboard
Recent Runs view
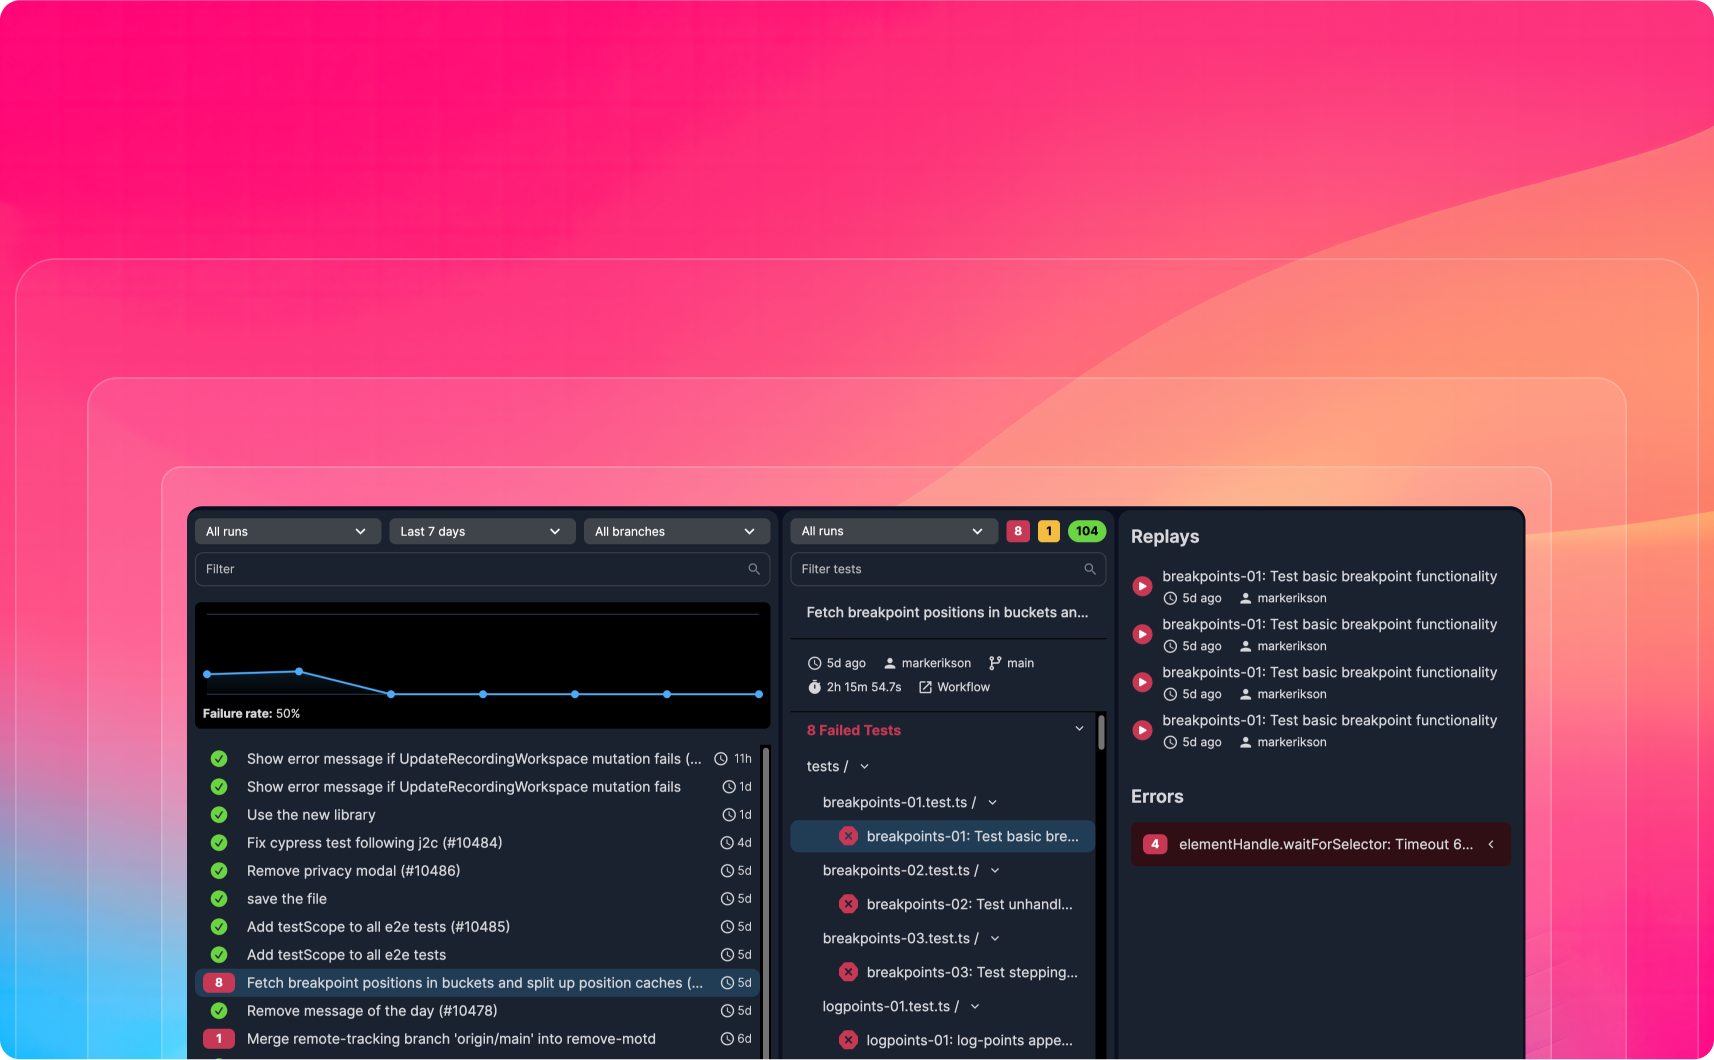
The Recent Runs view alerts you to new issues in your test suite so you can see which run introduced the problem and address it quickly.
Overview
The Recent runs view serves two purposes. The first is to make it easy to spot regressions quickly. The second is to help developers see their recent runs and jump into the replays.
Shareable URLs
When you notice a problem with a recent run, it’s easy to select the run, copy the URL, and share it with your team in Slack or Linear.
Recent Runs view
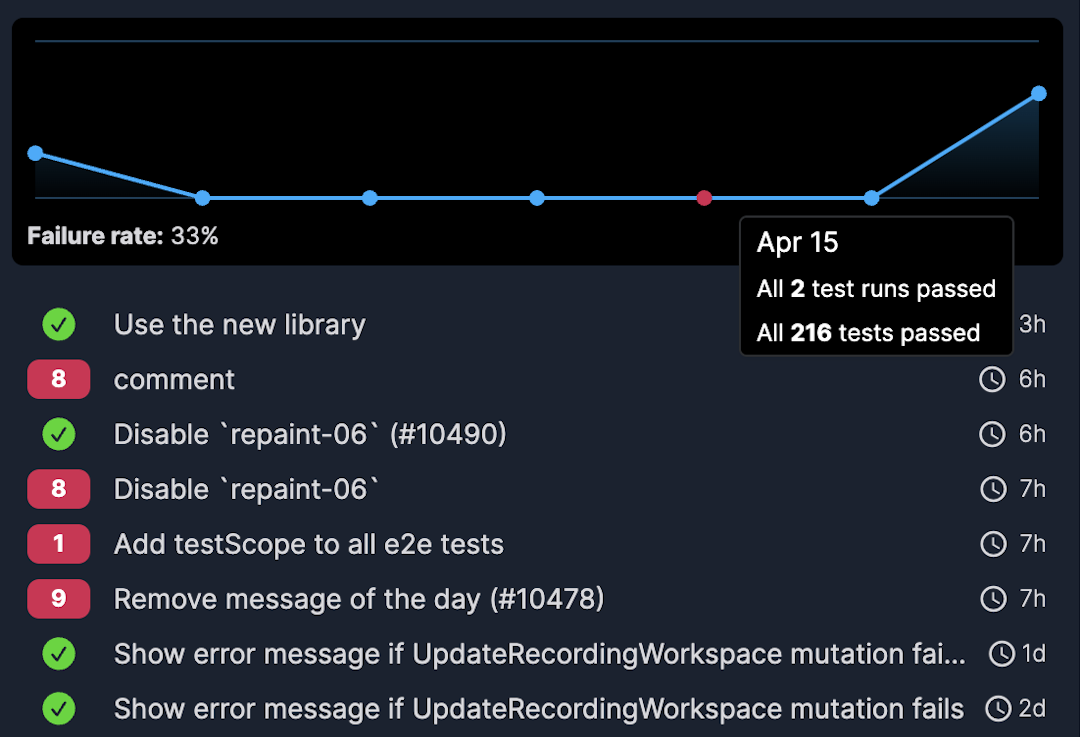
- Key Performance Indicators See your test suites’ failure rate and daily breakdown at a glance.
- Chronological list Spot regressions and drill down into recent test runs with the Recent Runs view.
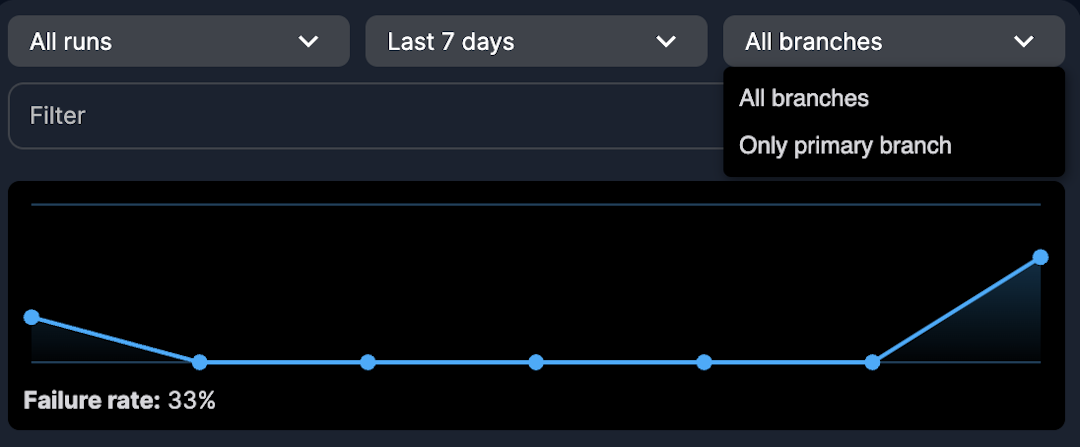
Filters
The Test Runs Filters help you view the most relevant run by branch, passing and failing runs, and commit message.
Run details
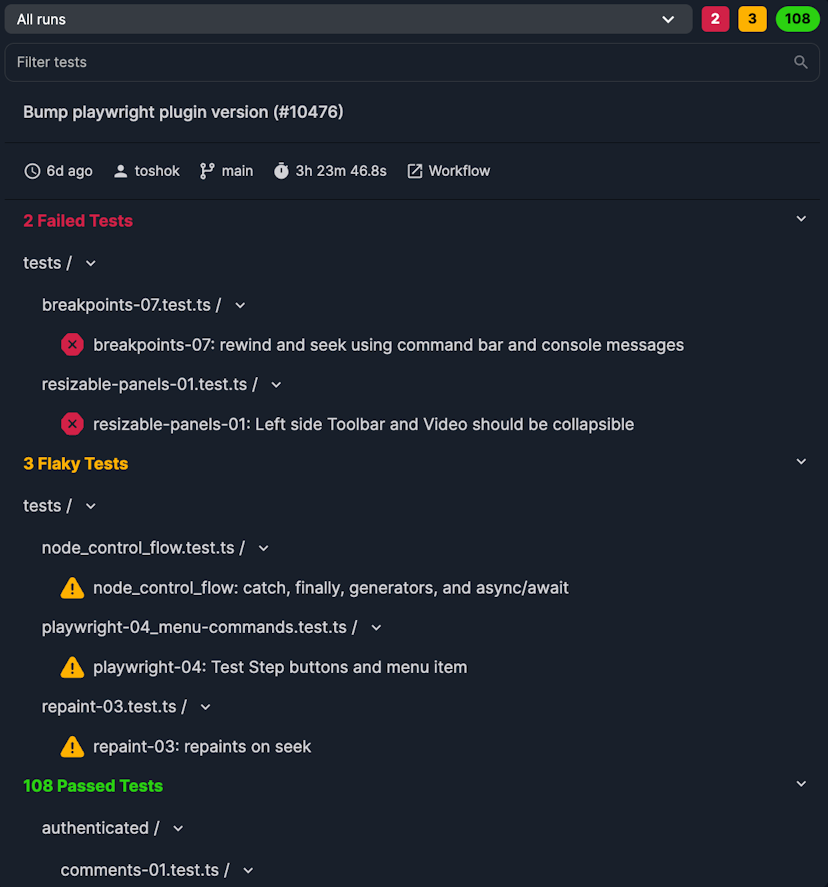
- Summary each runs are organized into a failing, flaky and passing tests.
- Metadata runs are associated with a commit message, author, branch name and other relevant metadata.
- Search find the tests you’re looking for quickly with powerful search and filtering.
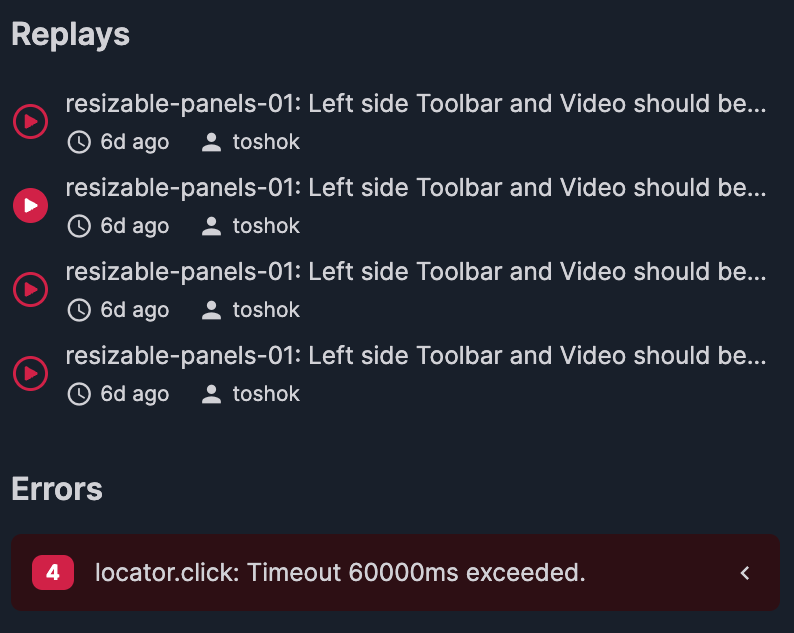
Test details
Test details include all recorded replays from the test run.
Common errors are displayed below to provide an overview of the test failure messages.
Clicking on a recording opens the replay so that you can inspect it with Replay DevTools.
PR comments
The Replay GitHub PR comment makes it easy to view a PR's recent runs.
Top failing and flaky tests
Go to the Failing and Flaky Tests view to see your top failing and flaky tests.